
Cost per lead vs. cost per sale
How contractors who sell in the home should judge their marketing, with a worked roofing example.
By Closenture · Updated November 5, 2026 · 7-minute read
| # | Source | Spent | Leads | Sales | Cost per lead | Cost per sale | Profit |
|---|---|---|---|---|---|---|---|
| 1 | Referrals | $600 | 15 | 5 | $40 | $120 | $23,900 |
| 2 | Google LSA | $7,200 | 80 | 9 | $90 | $800 | $36,900 |
| 3 | Door knocking | $6,000 | 60 | 6 | $100 | $1,000 | $22,350 |
| 4 | Angi | $4,800 | 96 | 2 | $50 | $2,400 | $4,300 |
| 5 | Home shows | $5,500 | 55 | 1 | $100 | $5,500 | −$1,125 |
| 6 | Facebook Ads | $9,000 | 200 | 1 | $45 | $9,000 | −$4,275 |
Ranked by cost per sale, Facebook Ads is your worst: $9,000 for one roof. Put the next $1,000 into Google LSA, where a sale costs $800.
Profit = sold × 35% margin after materials, labor and commission, minus marketing.
Cost per lead tells you what a lead cost. Cost per sale tells you what a customer cost. For contractors who sell in the home, cost per sale decides profit: cheap leads that never sit or never buy end up costing more than expensive leads that close.
The five numbers, from lead to sale
Every lead source can be judged at five points on the way to a signed contract. Use the same 90 days for all of them, because a lead from this month may not buy until next month.
- Cost per lead
spend ÷ leads. The number on the vendor’s invoice.- Cost per appointment
spend ÷ appointments set. Shows how many leads your setters can actually book.- Cost per ran appointment
spend ÷ appointments where the rep sat with the homeowner. Leaves out no-shows and cancellations.- Close rate
sales ÷ ran appointments. How often a visit from this source turns into a job.- Cost per sale
spend ÷ jobs sold. What one customer cost you. Compare it with the profit of one job.
A worked example: six sources, 90 days
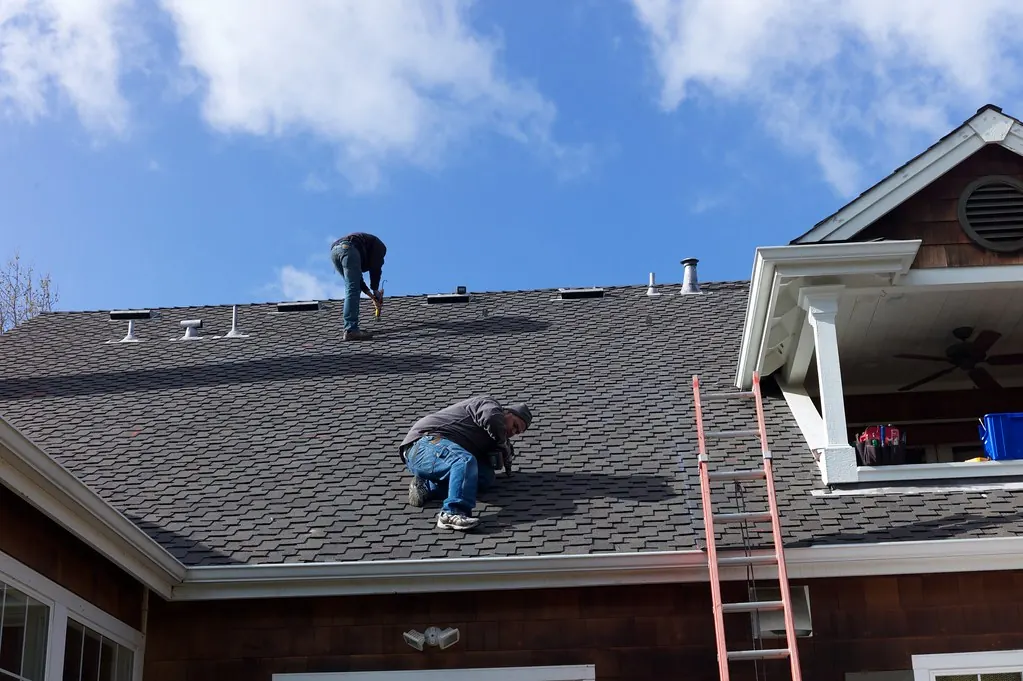
A roofing company with an average job of about $14,000 and a 35% margin after materials, labor and commission. Profit below is sold × 35% − spend.
| Source | Spend | Leads | Appts | Ran | Sales | Cost per lead | Cost per appt | Close rate | Cost per sale | Profit |
|---|---|---|---|---|---|---|---|---|---|---|
| Google LSA | $7,200 | 80 | 40 | 34 | 9 | $90 | $180 | 26% | $800 | $36,900 |
| Facebook Ads | $9,000 | 200 | 50 | 30 | 1 | $45 | $180 | 3% | $9,000 | −$4,275 |
| Angi | $4,800 | 96 | 30 | 24 | 2 | $50 | $160 | 8% | $2,400 | $4,300 |
| Door knocking | $6,000 | 60 | 36 | 30 | 6 | $100 | $167 | 20% | $1,000 | $22,350 |
| Home shows | $5,500 | 55 | 22 | 16 | 1 | $100 | $250 | 6% | $5,500 | −$1,125 |
| Referrals | $600 | 15 | 12 | 11 | 5 | $40 | $50 | 45% | $120 | $23,900 |
Ranked by cost per lead, Facebook Ads looks like the second-best source at $45 a lead. Ranked by cost per sale, it is the worst: $9,000 for one roof, a loss of $4,275. Google LSA costs twice as much per lead, $90, but a sale costs $800 and it left $36,900.
Look at cost per appointment too: Facebook and Google LSA tie at $180. The difference is what happens at the house. LSA visits close 26% of the time; Facebook visits close 3%.
What the example tells you to do
- Move money into Google LSA. At $800 a sale it is the cheapest paid source by far.
- Fix or cut Facebook Ads. The leads are cheap but they do not buy. Tighten the targeting or the form, or stop before the next bill.
- Pay for referrals. $600 in referral bonuses brought five sales. A bigger bonus is still the cheapest marketing you have.
- Rethink home shows. One sale for a $5,500 booth lost money at this close rate.
Your break-even cost per sale
The most useful single number: average job × gross margin. On a $15,000 job at a 35% margin, the break-even is $5,250. Any source where a sale costs more than that loses money on every job it brings, however cheap its leads look.
Rule of thumb: judge a new source after at least 90 days or 10 ran appointments, whichever comes later. Before that, one lucky sale can make a bad source look good.
How to track it without a spreadsheet
- Every lead needs a source. Tag website forms with the ad click, and give each vendor its own lead webhook.
- Every appointment needs a result. Sold, no sale, one-leg, follow-up, not qualified or no-show. Without results, close rates are guesses.
- Every sale ties back to its appointment and its lead. That is how a sale is credited to the right source, setter and closer.
- Spend goes in by source and month. Or as a cost per lead for vendors that bill per lead.
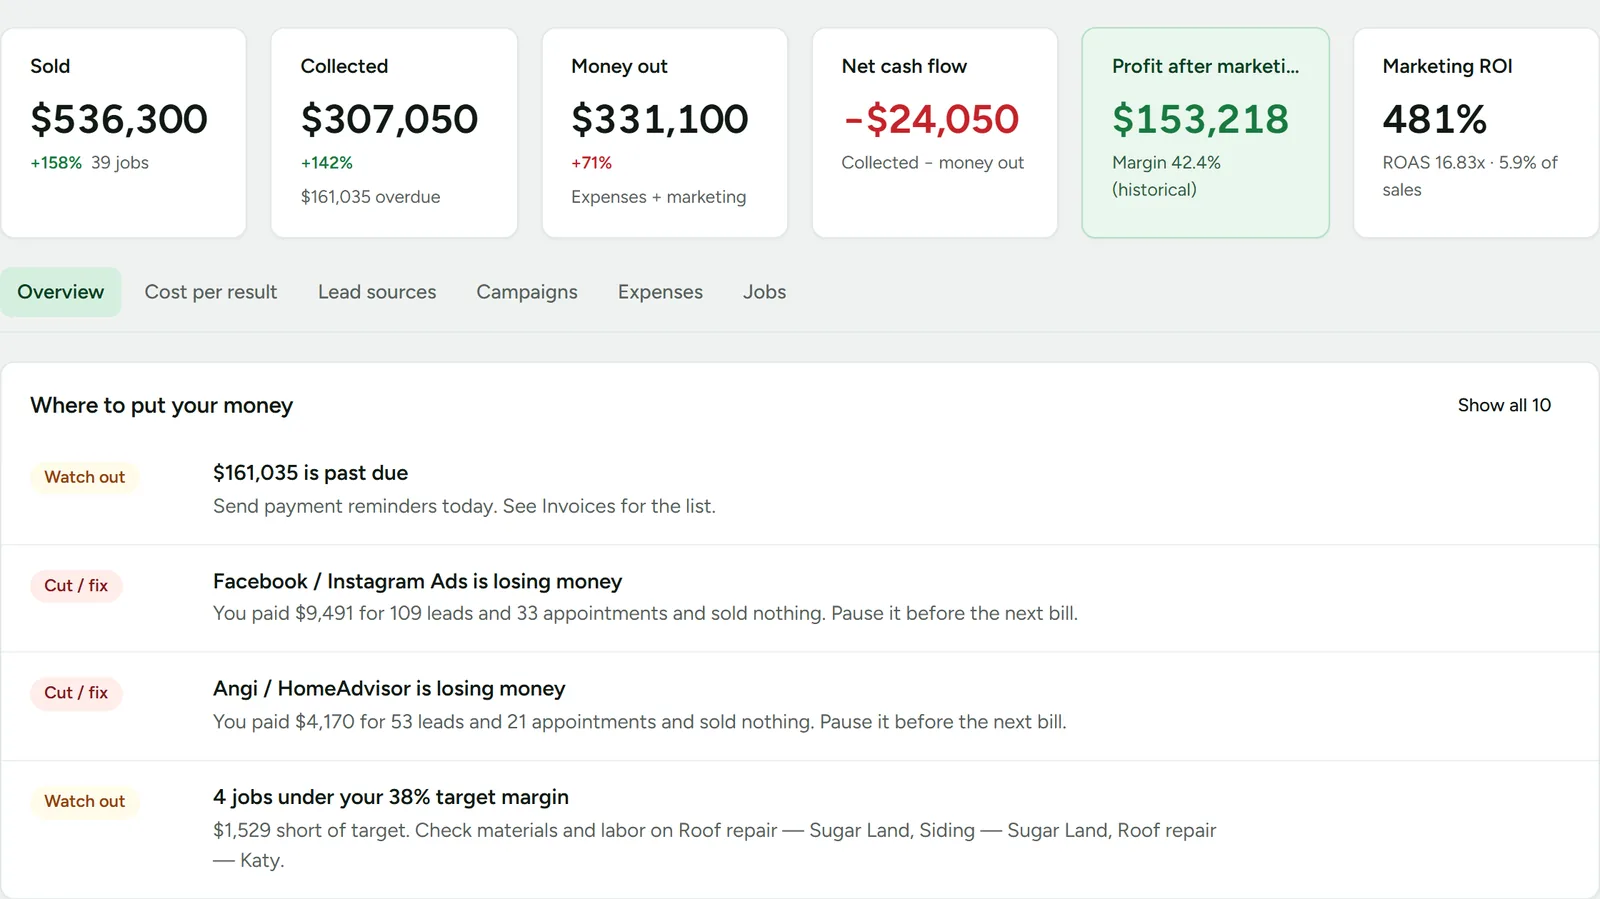
That chain is what the Money Map in Closenture builds for you: each lead from its source to the result, the contract and the money collected.
Common mistakes
- Judging too early. In-home sales lag. A source bought in March may close in April.
- Counting duplicates. The same homeowner from two vendors is one lead. Credit the first, or the one that booked.
- Leaving cancellations in. A job cancelled in the 3-day window is not a sale.
- Ignoring commission and job cost. A source that sells low-margin jobs can lose money with a good cost per sale.
- Blaming the source for a closer. Compare close rates by closer too, so one rep’s week does not decide a source’s fate.